Drawing Tools
There is a set of basic drawing tools, built into the product. You can access them using a toolbar left to the chart.
Saving
Please note that whenever you draw anything on the chart, it's saved in the simulation file alongside with the simulated date/time when you draw it. It means that whenever you rewind the simulation, you will lose everything you draw "in the future". It's a great way to make simulations more realistic. No more "signs from the future" :)
Named Charts
Yet another great feature is that you can rename charts which enables you to view everything you draw on all charts at once or at individual charts only.
If you open two EURUSD charts at once and draw a line at the first of them, it will become automatically visible on the second one as well. But, if you rename the second chart to "EURUSD1", for example, you will no longer see objects from the first charts there. Moreover: everything you draw on EURUSD1 will stay there and be visible only on other charts of the same ticker with the same name.
Time Frames
You can choose time frames to display a selected tool. This way you can make your high-level charts less cluttered. And, whenever you clone or draw a selected object again, it will inherit the same colors and time frame settings as the original one.
Shortcuts
You can assign shortcuts to any tool in application settings.
Let's look at the list of available drawing tools:
Cursors
Arrow - a standard Windows arrow cursor that adds nothing to the chart;
Arrow+Axis - a standard Windows arrow cursor that adds axis marks;
Cross - a combination of vertical and horizontal lines at the cursor point with axis marks.
Rulers
Ruler - using it, you can quickly measure a distance between two points on the chart;
Alert - places a horizontal level on the chart that displays an alert whenever the price hits it. You can also choose to stop or slow down the simulation whenever it happens. Please note that this is a "drawing tool", so you can't expect it to stop or slow down the simulation at exact price values. The best accurate alternative is using small stop/limit orders just for slowing down the simulation.
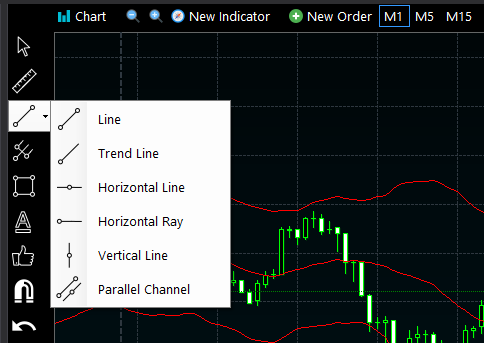
Lines
Trend Line - a line with fixed end points. Can be converted to other types of line if you need it;
Ray - the same as Trend Line but with a ray to the right;
Extended - the same as Trend Line but with rays on both ends;
Horizontal Line - a horizontal line;
Horizontal Ray - a point at the chart with the ray to the right;
Vertical Line - a vertical line;
Cross Line - a combination of horizontal and vertical lines;
Parallel Channel - a set of two lines forming a channel. You can add rays to the both sides of it as with other lines.
Fibonacci/Andrew's
Pitchfork - an Andrew's Pitchfork;
Fibonacci Channel - a Fibonacci Channel. You edit Fibonacci levels in application settings;
Fibonacci Retracement - a Fibonacci Retracement. You edit Fibonacci levels in application settings.
Shapes
Triangle - a semi-transparent triangle;
Rectangle - a sem-transparent rectangle. Please note that you can add left and right "rays" to it.
Text
Text - a way to draw a text on the chart. You can edit it with double-click, by the way.
Icon
Icon - add an icon to the chart. You can choose an icon from a huge list of built-in vector icons and resize them as large as you want. Please note that you can quickly fiter the icon list by typing a few characters into the "filter" field.
Magnets
"Magnet" means that any object you draw or move will stick to the closest open/high/low/close price of the bar.
Magnet Off - turn off the magnet;
Weak Magnet - a weak magnet. You can edit its "strength" in application settings;
Strong Magnet - a strong magnet. You can edit its "strength" in application settings.
Undo/Redo
Undo - undo the most recent drawing action. It may be absolutely everything, starting from adding new objects and up to moving and deleting them;
Redo - undo the most recent undo;
Reopen - whenever you close a chart, you can reopen it using the list here.
Screenshots
Copy Screenshot - copies a screenshot of the current chart to the clipboard, then you can paste it wherever you want;
Save Screenshot - saves a screenshot of the current chart to a file;
Save Screenshot to a Folder - here you can choose a folder where to save all your screenshots without the need to see a file save dialog every time you save them.
View
Bid - toggle current bid price display level;
Ask - toggle current ask price display level;
Grid - toggle the chart grid;
Period Separators - toggle period separators;
Market Hours - toggle market hours colored backgrounds. You can edit market hours and their colors in application settings;
Show Order Triangles - choose time frames to display order triangles to make charts less cluttered;
Show Order Lines - choose time frames to display order triangles to make charts less cluttered.
Remove
Remove Drawing Tools - removes all objects you draw from the chart;
Remove Indicators - removes all indicators from the chart;
Remove Drawing Tools and Indicators - removes both drawing tools and indicators.