Settings
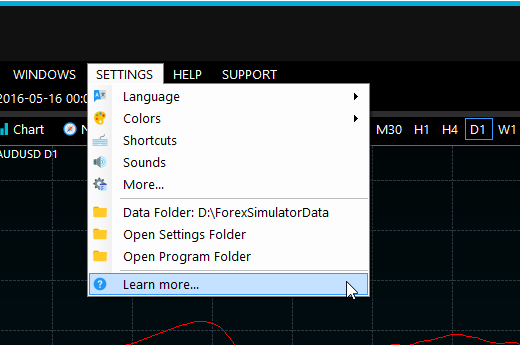
All global application settings reside in the corresponding Settings menu:
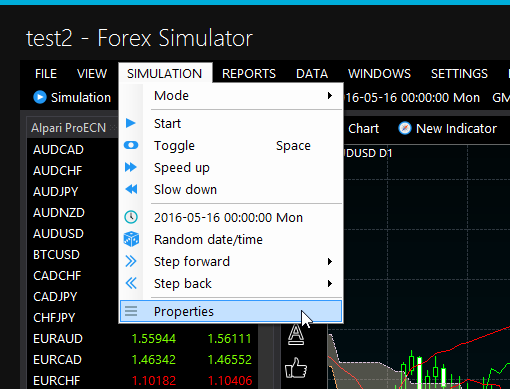
Please note that there is a different set of settings for the current simulation available at Settings /Properties menu item. Whenever you modify global simulation settings like leverage they will be automatically copied to the current simulation and applied to all the next simulations you create.
An important notice: whenever you update settings for a simulation, they will be saved at the exact simulated date you did it. So, if you rewind the simulation past that date, these settings will be lost. The best way to make such settings persistent is to create a new similation that will copy global simulation settings of your choice.
Language - switch between languages or help the author to translate the product. Translators get a free license, by the way.
Colors - switch between day/night mode, choose a better chart color scheme or edit it.
Hot Keys - set up hot keys.
Sounds - choose what sounds to play and turn them on and off.
Data Folder - move data to a bigger and faster hard disk if you like. Please use an SSD one because it will significantly increase simulation speed and responsiveness.
You don't need to move all the data manually. It's enough to choose a new location, then the data will be moved automatically on product restart.
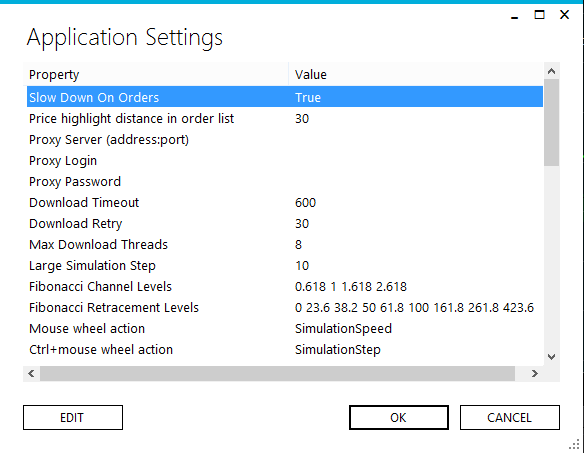
More... - other settings, let's look at them closely. Please note that any simulation-specific settings will NOT be automatically copied to your current simulation. You will need to either create a new simulation or alter them manually in SIMULATION->Properties menu.
-
Slow down on orders
Automatically resets simulation speed when any of the orders get filled or closed.
This way you can safely speed up the simulation knowing that it will automatically slow down on limit order activation, SL, TP or margin call.
-
Price highlight distance in the order list
How close must be the price to the SL or TP levels to highlight them in the list?
This value is measured in pps.
-
Proxy server
An address and a port of a proxy server if you have no direct internet connection. Please note that port is required, there are no default proxy ports. You must enter it as domain.com:8080, for example.
-
Proxy Login
Your login at the proxy server, if required.
-
Proxy Password
Your password at the proxy server, if required.
-
Download Timeout
How long to wait when downloading the data until giving up and restarting downloads? Use it to optimize download speeds on unreliable internet connections.
This value is in seconds.
-
Download Retry
How long to wait until trying to download the data again after an error?
This value is in seconds.
-
Large Simulation Step
By default all calculations run at 1-second intervals. It means that you you get 1-second precision on values like max profit, max drawdown, etc.
Whenever you are making big steps forward, something like 1 day or even 1 week, it will take a long time to calculate changes over a large number of orders if we try to do it for each and every second. It means going through 24*60*60=86,400 cycles for each of the orders. In this case it may be better to make larger steps to speed up the simulation.
There is a tradeoff between speed and precision and it's up to you to decide which way to choose.
This value is measured in seconds but it's automatically multiplied by 5 for advances longer than 4 hours and by 30 for advances longer than a day.
-
Fibonacci Channel Levels
Here you can edit default levels for Fibonacci Channel drawing tool.
-
Fibonacci Lines Levels
Here you can edit default levels for Fibonacci Lines drawing tool.
-
Mouse wheel action
What will happen when you scroll the mouse wheel?
If you don't like an idea of speeding up/slowing down the simulation using mouse, choose something else instead. You can scroll the chart or zoom it if you like.
-
Ctrl+mouse wheel action
What will happen when you scroll the mouse wheel while holding the Ctrl key?
-
Alt+mouse wheel action
What will happen when you scroll the mouse wheel while holding the Alt key?
-
Shift+mouse wheel action
What will happen when you scroll the mouse wheel while holding the Shift key?
-
Account currency
The default account currency for new simulations.
Please don't change it because it's not completely tested yet and I'm not sure that it will work properly.
-
Account currency formatting
A way all financials numbers get formatted. The default value is ${0} where {0} will be replaced with an actual number. If your currency sign should go after the number, please place it accordingly: {0}p
-
Initial account balance
The default account balance for new simulations.
It's measured in account currency.
-
Leverage
The default leverage for new simulations as 1/X.
For 1:100 leverage you should enter 100 here.
-
Minimum stop distance from the current price, pps
The minimum distance in pps from the current price to create SL and TP orders. Depends on your broker.
-
Minimum lot size
The default minimum order size in lots for new simulations. All order sizes will also be rounded to the corresponding precision. For example, when this walue is 0.01, all order sizes in lots will look like 1.05.
-
Minimum limit/stop order distance from the current price, pps
The minimum distance in pps from the current price to create limit and stop orders. Depends on your broker.
-
Margin call level, %
When does your broker calls you about your margin getting too low?
By default, it will automatically close the most recently opened of your positions whenever the margin call happens.
This value is measured in % of your free margin to total margin.
-
Default lot size
The default lot size for new simulations. You can edit those of them that different from this number in Custom lot sizes option.
-
Custom lot sizes (one per line)
While you can edit a common lot size for currency pairs in the first option, here you can add some outliers like metals, for example.
Each of the lot sizes must be on a separate line, separated by spaces, like:
XAUUSD 100
where XAUUSD - a ticker name, 100 - the size of a single lot.
-
Swaps, pps
Here you can edit swaps (overnight cost of holding the position) for each of the currency pairs.
Each of the tickers must be on a separate line, followed by a short swap, then a long swap, in pps. If you use 5-digit quotes and your broker lists swaps in pips, you should multiply these numbers by 10.
These values will be automatically tripled when holding position from Wednesday to Thursday.
As for USDTRY, it's tripled when holding positions from Thursday to Friday.
-
Comission per 1,000,000 units
The default comission for new simulations.
It's calculated in account currency per million units. For example, when using Alpari, the typical comission is $15, so you should enter 15 here.
-
Slippage min and Slippage max, pps
You will get a random slippage when filling orders between these values. It's the most easiest way to simulate real-world trading.
Please note that dynamic slippage may override this maximum value.
-
Dynamic slippage ratio, %
You will get a random slippage when filling orders depending on current one-minute volatility. It's measured in percents from the last 1-minute bar range.
It's a more realistic way to simulate real-world slippage when trading during major news or announcements.
For example, if you enter a static slippage between 5 and 10 pps, plus 20% for dynamic slippage, you will get the following trading conditions:
When the market is calm, one-minute fluctuations aren't higher than 50 pps. You will always get random slippage between 5 and 10 pps.
But, when the market gets fueled by some events, one-minute fluctuations may be higher than 100 pps. It means that you will get the maximum slippage of up to 100*20%=20 pps. If the market becomes crazy by moving for more than 300 pips per minute, you will get up to 60 pps slippage.
-
Simulation Speeds
Here you can edit simulation speeds that will be available when you choose them from a drop-down menus or speed up/slowing down the simulation.
-
Simulation Steps
Here you can edit simulation steps that will be available when you choose them from a drop-down menus or by using shortcuts.
You can use the following suffixes in this list:
- t, tick, ticks for ticks;
- b, bar, bars for bars;
- s, sec, second, seconds for seconds;
- m, min, mins, minute and minites for minutes;
- h, hour, hours for hours.
-
Breakeven Stop Loss, pps
Here you can set the minimum distance from the current price at which your broker enables you set stop loss orders.
It's measured in pps.
-
Order Volumes
Here you can edit the list of available volumes that you see in order dialogs.
Please note that you may enter not only values in lots but percentages as well. In this case actual order sizes will be calculated at the moment you create an order, as a share of margin required from your current account balance.
For example, at 10% you will be able to open only 10 orders until you use all your available margin.
-
Close Volumes
Here you can edit the list of available partial close percentages that you see in order dialogs.
For example, 50% means that you will partially close a half of your order size.
-
Drawing Colors
Here you can edit the list of default drawing tool colors.
Whenever you draw anything on the chart, it will be drawn with a random color from this list until you manually choose a color for a specific drawing tool for the very first time. From that point, all drawing tools of this type will use the color of your choice.
If you don't want to get random colors, you can leave just a single color there.
-
Market Hours
Whenever you select an option to display market hours on the chart, its colors will go from here.
Here you can add markets as well as their work hours in GMT, plus a color to highlight on the chart.
-
Chart Font Size
If you are unsatisfied with the chart font size, you can change it here.
-
Trading Window Step, pps
If you find 1 pps too low for you to manage orders in the trading window, you can set something like 10 here. In this case its rows will become 10 pps high, that will enable you to see more orders there as well as create distant limit/stop orders with a click of a button.
-
Chart Default Horizontal Zoom
Default value for horizontal zoom of new charts. Technically speaking, its a bar width so the higher it is, the bigger bars will look on the screeen.
-
Chart Max Horizontal Zoom
Max horizontal zoom for all charts. Please note that it means bar width in pixels which is contrintuitive. The higher the zoom value, the bigger bars will look on the screen.
-
Chart Min Horizontal Zoom
Min horizontal zoom for all charts. Please note that it means bar width in pixels which is contrintuitive. The higher the zoom value, the bigger bars will look on the screen. The minimum value is 1 pixel.
-
Chart Horizontal Zoom Speed
How fast will horizontal zoom change when you zoom via the mouse wheel? The higher this value, the less mouse wheel turns you need to make to go from minimum to maximum zoom and vice verca.
-
Chart Max Vertical Zoom
Here you can edit the maximum value of chart zoom. Experiment with it until you find a value that is the most convenient for you.
-
Chart Min Vertical Zoom
Here you can edit the minimum value of chart zoom. Experiment with it until you find a value that is the most convenient for you.
-
Chart Vertical Zoom Speed
How fast will vertical zoom change when you zoom via the mouse wheel? The higher this value, the less mouse wheel turns you need to make to go from minimum to maximum zoom and vice verse.
-
Object Ctrl+Click Action
What happens if you click a chart object, holding the Ctrl key at the same time?
- None - do nothing;
- Clone - create an exact copy of the object; (default)
- Draw - draw the same object again, using the same settings like colors, time frame, etc.
- Delete - delete the object.
-
Object Shift+Click Action
What happens if you click a chart object, holding the Ctrl key at the same time?
- None - do nothing;
- Clone - create an exact copy of the object;
- Draw - draw the same object again, using the same settings like colors, time frame, etc. (default)
- Delete - delete the object.
-
Object Alt+Click Action
What happens if you click a chart object, holding the Ctrl key at the same time?
- None - do nothing;
- Clone - create an exact copy of the object;
- Draw - draw the same object again, using the same settings like colors, time frame, etc.
- Delete - delete the object. (default)
-
Show Order Triangles
On what time frames should closed order triangles be visible?
If you do a lot of intraday trading, it's a good idea to hide these triangles from daily and monthly charts to make them less cluttered.
-
Show Order Lines
On what time frames should closed order lines be visible?
If you do a lot of intraday trading, it's a good idea to hide these triangles from daily and monthly charts to make them less cluttered.
-
Default Curve Tension
You can play with this number to make curves like moving averages more or less "curved".
-
Weak Magnet Strength
A minimum amount of pixels between mouse cursor and open/high/low/close price of the bar under the cursor to make objects stick to it.
-
Strong Magnet Strength
A minimum amount of pixels between mouse cursor and open/high/low/close price of the bar under the cursor to make objects stick to it.
-
Use HTTPS connection
Use it whenever you experience problems connecting to the server or downloading the data, especially on mobile Internet connections where your mobile carrier can shape or block some types of traffic.
Please note that it will slow down downloads by approximately 20-30% because of 2-way traffic encryption. You should not use this option if everything works fine without it.
-
Show FPS
Whenever you experience slow chart drawing speed, please turn on this option and look into the right bottom corner of the chart. Here you will see the maximum number of frames per second the application is able to draw. Please report it to me, then I will find a way to make your charts draw faster.
There are no "standard" value for this number. It's all about overall responsiveness:
Less than 10 - almost unusable, you should definitely contact me.
10-30 - comfortable but with noticeable lags when drawing.
30-60 - comfortable.
60+ - real-time, the speed you get in video games.
-
Paint gradient backgrounds
If you want your charts look cool, you can turn on this option. Please note that it will slow down chart rendering speed. Use it only if it's still comfortable to exercise.
-
Multi-threaded drawing
You should turn on this option if you experience slow drawing speed and there is no way to fix it. Your computer is outdated, there are plenty of other heavy processes running, etc. It will move all drawing processes into background which will make the application more responsive but at a cost: charts will not be smooth when you scroll or move them. But, at least, it's still will be more comfortable to exercise than with direct drawing.
-
Drag Charts Horizontally
You can turn on and off horizontal chart scroll when you drag it. -
Drag Charts Vertically
You can turn on and off vertical chart scroll when you drag it.